OBJECTIVES:
VIRTUAL PRE-LAB EXPERIMENT:
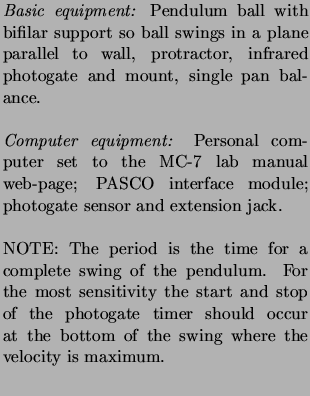
APPARATUS:
![$\textstyle \parbox{0.40\linewidth}{\hspace*{.1in}
\includegraphics[width=2.in]{...
...um ball and bifilar support.
NOTE: $L$ and $l$ are equivalent.
\end{center} }$](img272.png)
SUGGESTED EXPERIMENTAL TECHNIQUE:
REQUIRED INVESTIGATIONS: (Error analysis required only for item 3)
Plot the measured period as a function of angular amplitude including a few error bars.
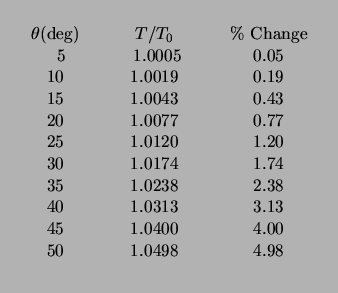
The accurate formula for period as a function of amplitude ![]() is:
is:
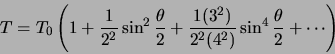
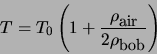
where
![]() and
and ![]() is the angular amplitude.
The results follow:
is the angular amplitude.
The results follow:
![$\textstyle \parbox{0.40\linewidth}{\hspace*{.05in}
\includegraphics[width=1.8in]{figs/m07.eps}
}$](img278.png)
Compare your plot (above) with values predicted from this table.
I. Plot period (![]() ) versus length (
) versus length (![]() ) and extend the curve to
) and extend the curve to ![]() .
Can you tell at a glance how
.
Can you tell at a glance how ![]() depends on
depends on ![]() ?
?
II. Plot ![]() vs L. What is the shape of this curve? What can you tell
from this curve about the dependence of
vs L. What is the shape of this curve? What can you tell
from this curve about the dependence of ![]() on
on ![]() ?
?
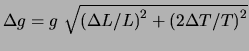 . (Take a look at the ``Errors and Uncertainties'' section of this manual.)
Is the accepted value within the limits you have set? If not,
can you explain it?
(Consider optional items below. The string lineal density is 0.5 g/m, and
. (Take a look at the ``Errors and Uncertainties'' section of this manual.)
Is the accepted value within the limits you have set? If not,
can you explain it?
(Consider optional items below. The string lineal density is 0.5 g/m, and
OPTIONAL EXERCISES: