|
EXERCISE: At right is a sketch of a compound pendulum. There is a bar
that you can swing into place which will give half the swing a length
L1 + L2 and the other half of the swing a length L2. The bar should
be positioned so the right face just touches the string when the pendulum
is at rest and hangs freely. In your lab book first estimate the period of the
motion (explain your logic) and then conduct the experiment (stating the
steps in your experiment). Is your measured value close to what you
expected?
OPTIONAL CALCULATIONS (these pertain item 4 about):
-
Show that the buoyant force of air increases the period to
where T0 is the period in vacuum and  is the density. Test by swinging simultaneously two pendula of equal length but with bobs of quite different densities: aluminum, lead, and wooden pendulum balls are available. (Air resistance will also increase T a comparable amount. See Birkhoff ``Hydrodynamics,'' p. 155.) is the density. Test by swinging simultaneously two pendula of equal length but with bobs of quite different densities: aluminum, lead, and wooden pendulum balls are available. (Air resistance will also increase T a comparable amount. See Birkhoff ``Hydrodynamics,'' p. 155.)
-
The finite mass of the string, m, decreases the period to
where M is the mass of the bob (S.T. Epstein and M.G. Olsson, American Journal of Physics 45, 671, 1977). Correct your value of g for the mass of the string.
|
![\includegraphics[width=1.5in]{figs/m07-02.eps}](img163.gif)
Fig. 2: A compound pendulum
|
![\includegraphics[width=2.2in]{figs/m07-01rev.eps}](img143.gif)
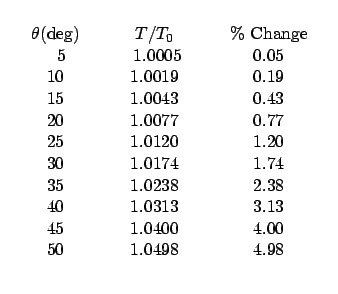
 sin4
sin4
![$\textstyle \parbox{0.40\linewidth}{\hspace*{.05in}
\includegraphics[width=1.8in]{figs/m07.eps}
}$](img153.gif)

![\includegraphics[width=1.5in]{figs/m07-02.eps}](img163.gif)
