


Next: S-2 Velocity of Sound in
Up: Sound and Waves
Previous: Sound and Waves
Contents
OBJECTIVE: To study propagation of transverse
waves in a stretched string.
INTRODUCTION:
- A standing wave in a string stretched
between two
points is equivalent to superposing two traveling waves on the string
of equal frequency
and amplitude, but opposite directions. The
distance between nodes (points of minimum motion) is one
half wavelength, (
 /2).
/2).
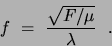
The wave velocity,  , for a stretched string is
 where F = tension in the string and
  = mass per unit length. But
v = f and hence
= mass per unit length. But
v = f and hence
 |
(1) |
Figure 1:
The Modes of a String
|
|
Figure 2:
A close-up
![\includegraphics[height=1.6in]{figs/l103/s01-2.eps}](img649.png)
|
PART A: Waves from a mechanical driver (i.e. a speaker)
APPARATUS:
- Basic equipment:
Electrically driven speaker; pulley & table clamp assembly; weight holder &
selection of slotted masses; black Dacron string; electronic balance;
stroboscope.
- Computer equipment:
Personal computer; PASCO
 interface module; power amplifier module;
various electrical connectors.
interface module; power amplifier module;
various electrical connectors.
The set-up consists of an electrically driven speaker
which sets up a standing wave in a string stretched between the speaker
driver stem and a pulley. Hanging weights on the end of the string past the pulley
provides the tension.
The computer is configured to generate a digitally synthesized
sine wave (in volts versus time) with adjustable frequency and amplitude (max:  10 V).
PASCO interface: This transforms the digital signal into a smooth analog signal for input
into the power amplifier.
- Power amplifier: The amplifier transforms the voltage sine wave single into a current suitable
to drive the loudspeaker. (A few exotic speakers, often referred to as electrostatic speakers,
actually utilize high voltages directly to produce sound.)
- Precautions: Decrease the amplitude of the signal if the speaker makes a rattling sound, or if the red pilot light
on the amplifier is lit. The generator is set to produce sine waves; do not change the
waveform.
Note: Although the speaker is intended to
excite string vibrations only in a plane, the
resultant motion often includes a rotation of this plane. This arises from
non-linear effects since the string tension cannot remain constant under
the finite amplitude of displacement. [See Elliot,
Am. J Phys. 50, 1148, (1982)].
Other oscillatory effects arise from coupling to resonant vibrations
of the string between pulley and the weight holder; hence keep this length
short.
Figure 3:
The apparatus
![\includegraphics[width=4.7in]{figs/s01-07.eps}](img652.png) |
SUGGESTED EXPERIMENTS:
PROCEDURE I: Checking Equation (1)
- Place the sheet of paper provided on the table; this will make it easier
to see the vibration of the string. Measure accurately the distance,
 ,
between the bridge and the pin of the speaker using the two meter ruler; record
this in your lab notebook. Click on the LAUNCH EXPERIMENT icon (i.e., the
telescope), from the on-line lab manual. The computer monitor will appear as shown
in Fig. 4.
,
between the bridge and the pin of the speaker using the two meter ruler; record
this in your lab notebook. Click on the LAUNCH EXPERIMENT icon (i.e., the
telescope), from the on-line lab manual. The computer monitor will appear as shown
in Fig. 4.
- You will see that the computer is set to produce a 60
 sine wave with an amplitude
of 3
sine wave with an amplitude
of 3  . To start the string vibrating CLICK the ``ON'' button.
- CLICK on the
up/down arrow in order to change the amplitude or the frequency of the signal
although
this produces rather large steps.
In order to produce other step increments
see the table below or simply double click right on the display number itself to
use numeric input.
Figure 4:
The PASCO display
|
|
Table 10:
Controlling the Signal Generator
| Keyboard | Change in  | Amp. Change |
| Shift key | 100 Hz | about 2.00 V |
|
No key | 10 Hz | about 1.00 V |
|
Ctrl key | 1 Hz | about 0.50 V |
|
Alt key | 0.10 Hz | about 0.10 V |
|
Alt + Ctrl | 0.01 Hz | about 0.02 V |
|
keys | | |
|
- At 60 check eqn. 1 by first calculating the necessary string tension
to produce a standing wave in the third or forth mode.
Weigh the string to get . Your instructor will provide you with a one
meter length of string. (Dacron 30# has
 0.283 g/m.) Note that the hanger itself has a 50
  mass so it may not be easy
to access the forth mode (depending on ).
mass so it may not be easy
to access the forth mode (depending on ).
Check your results by adjusting the string tension by increasing/decreasing
the weight to find the tension which results in the largest
amplitude vibrations. How do the two values (calculated and measured) compare?
- Now put a 200 mass on the mass hanger and restart the signal
generator.
Record the total mass and tension in your lab book.
- Adjust the frequency so that the amplitude of the oscillation is at its
maximum by changing the frequency in 1 steps. This is best done as
follows: First decrease the frequency until the amplitude of the string is very
small.
Then increase the frequency in 1 steps, observe that the
amplitude first increases and then decreases. Record the best frequency  in your table.
- Change the frequency to observe the third mode. Find and record the best
frequency (using 10 steps at first may be faster).
- Find and record the frequency of the higher modes.
- OPTIONAL: Check the frequency of the string in its 2nd mode with the stroboscope.
Note that the stroboscope is calibrated in RPM or cycles per minute, NOT
(cycles per second). You should find a value close to 70 .
ANALYSIS:
- Divide the various frequencies
 by
by  and enter the values in a table.
Calculate the average value of
and enter the values in a table.
Calculate the average value of  ; this is the expected value of the frequency of the first
mode.
; this is the expected value of the frequency of the first
mode.
- Calculate the velocity of propagation on the string using the appropriate equation.
- Calculate the mass per unit length of the string.
How do the two values for the string mass per unit length compare?
PROCEDURE II: vs string tension
- In this section you will investigate the dependence of the resonant frequency of a string as
a function of the applied tension.
- 1.
- Choose six masses between 100 gm and 1 kg and enter the values in the data table.
- 2.
- Determine the resonant frequency of the second mode of the string under these different
tensions and record your results. (Hint: increasing the mass by a factor of two increases
by nominally a factor of
 .)
.)
- 3.
- Plot a graph of frequency versus mass,
 , and include the zero value.
- 4.
- Plot a graph of frequency versus
 and again include the zero value.
QUESTIONS:
- Which of the two graphs can be fitted with a straight line? A parabola? Why?
- From the slope of the graph having the linear relationship obtain the mass per unit
length of the string and compare to your previous result.
PART B: ``Virtual'' waves on a drum head
PROCEDURE III: (If time permits)
- Vibrations of a circular drum head
In this section you will examine, via a virtual demonstration, the vibrational modes of
a two dimensional drum head.
The (0,1) Mode
| 1. Click on the icon at left to down-load and initiate the MPEG
movie plug-in to observe the ``first'' mode.
2. Use the replay and step frame functions to view the motion.
3. Where is the displacement at a maximum? Always at a minimum?
|
The (0,2) Mode

| 1. Click on the icon at left to download and initiate the MPEG
movie plug-in to observe the first of the two ``second'' modes.
2. Use the replay and step frame functions to view the motion.
3. Where is the displacement at a maximum? Always at a minimum?
|
The (1,1) Mode

| 1. Click on the icon at left to download and initiate the MPEG
movie viewer to observe the second of the two ``second'' modes.
2. Use the replay and step frame functions to view the motion.
3. Where is the displacement at a maximum? Always at a minimum?
All mpegs created by
Prof. Dan Russel,
Kettering University |
Next: S-2 Velocity of Sound in
Up: Sound and Waves
Previous: Sound and Waves
Contents
Physics Laboratory
2001-08-29
![\includegraphics[height=2.4in]{figs/l103/s01-1.eps}](img648.png)
![\includegraphics[width=3.7in]{figs/s01-08.eps}](img654.png)